Creating your first dashboard
Learn how to create your own dashboards though customisable insights
Cohort Insights
The Cohort Insights area enables in-depth exploration of any cohort or all your data.
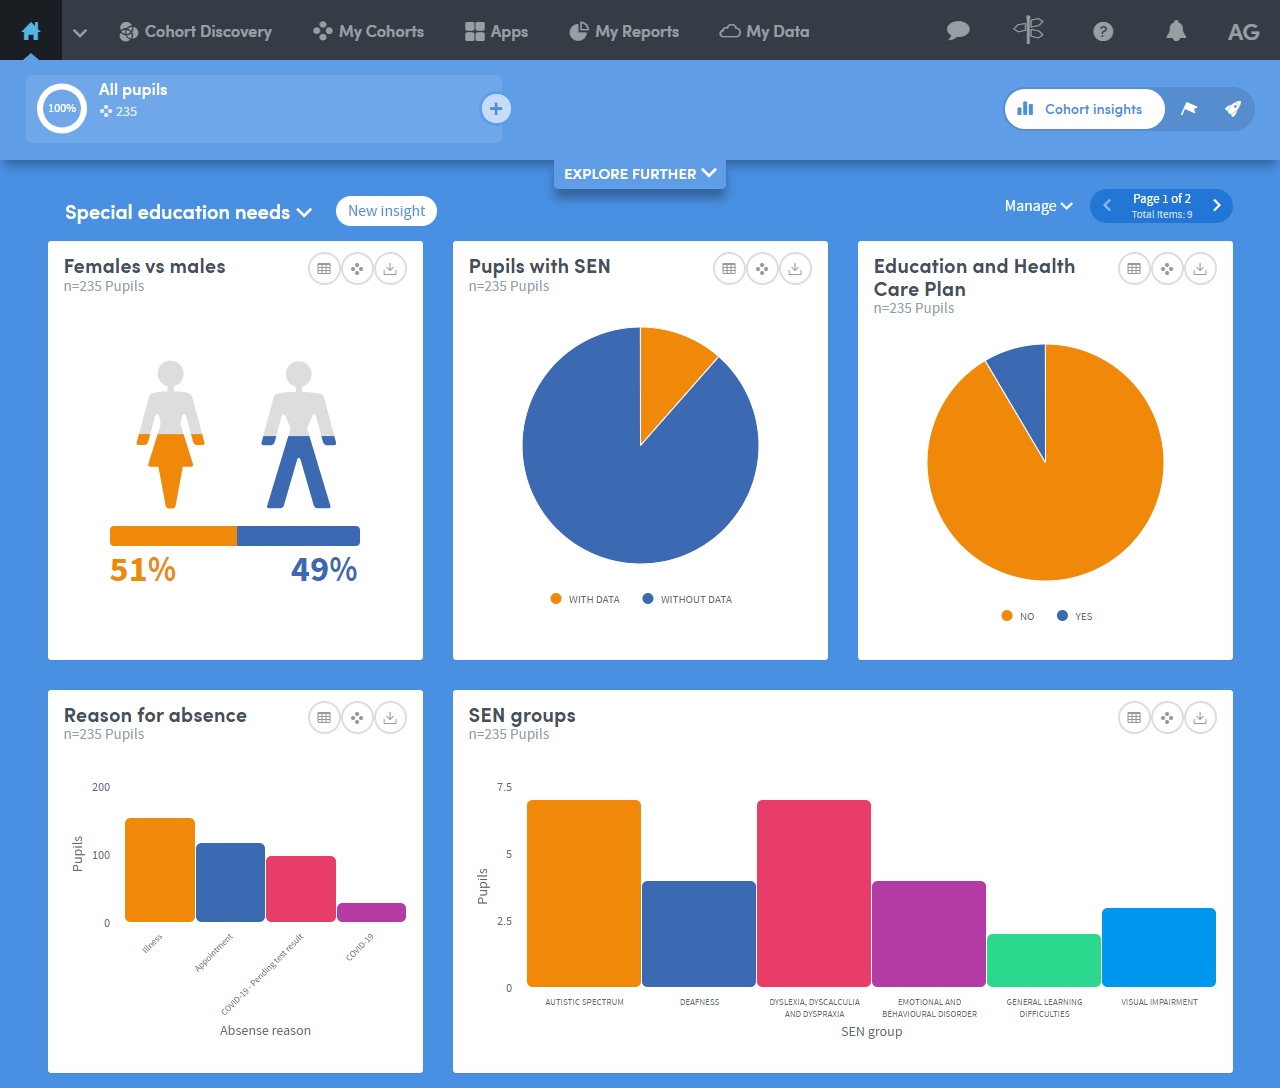
By default, it will display information about your base cohort, but you can select any of the cohorts available to you. You can then view and explore graphical representations of many different aspects of the cohort you’ve selected.
You can create your own custom cohort insights with just a few clicks, following a simple step-by-step process. You can select the cohort insight you want to create, the data you want to use, and how the results should be visualised.
You can also choose which insights to display and organise them into dashboards.
If you’re new to Atmolytics, you may not have many (or any) cohorts to explore, other than your base cohort (all subject matter data currently uploaded). Once you start using Atmolytics to create more cohorts, you’ll be able to view any of them in Cohort Insights.
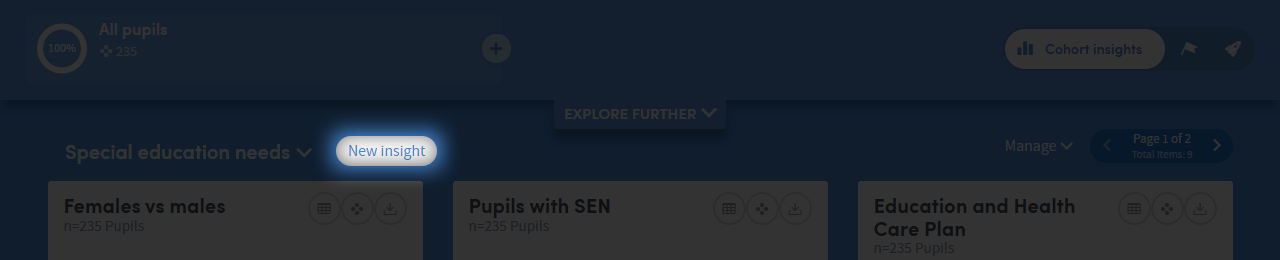
How to create a new cohort insight
To create your own cohort insight, click new Insight:
You’ll be taken to the new cohort insight screen:
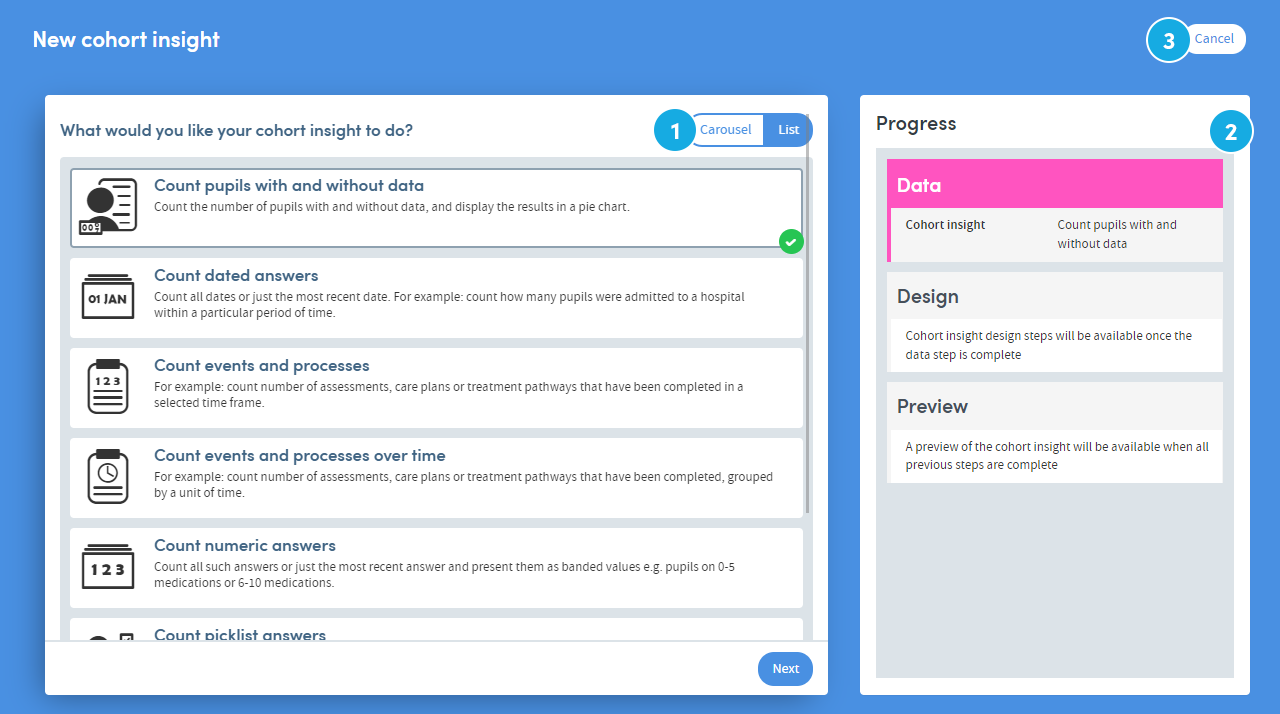
- You can view the list of cohort insight types and their descriptions as a list (shown here) or a browseable carousel
- The Progress panel tracks the choices you make while creating your insight
- Click here to cancel the creation process and return to the main Cohort Insights area
From this screen you’ll be taken through a simple step-by-step process where you’ll:
- Choose the type of insight you want to create;
- Choose the data you want to explore;
- Choose your display options, and
- Name, preview and save your new insight
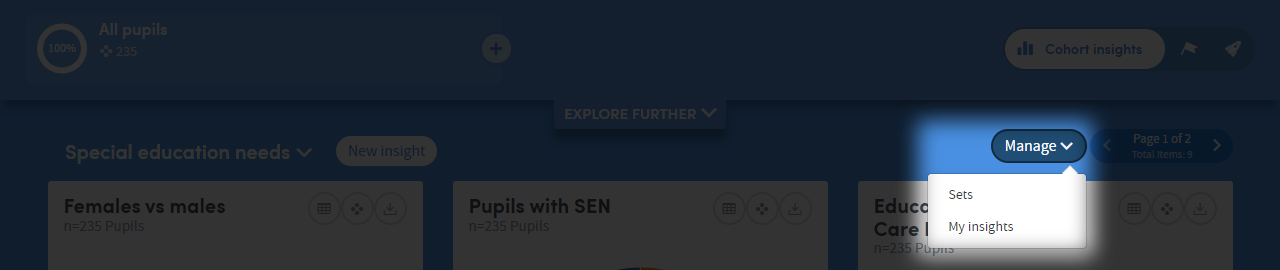
Organising your insights into dashboards (sets)
To create an insight set, click Manage at the top right of the Cohort Insights area, and select Sets:
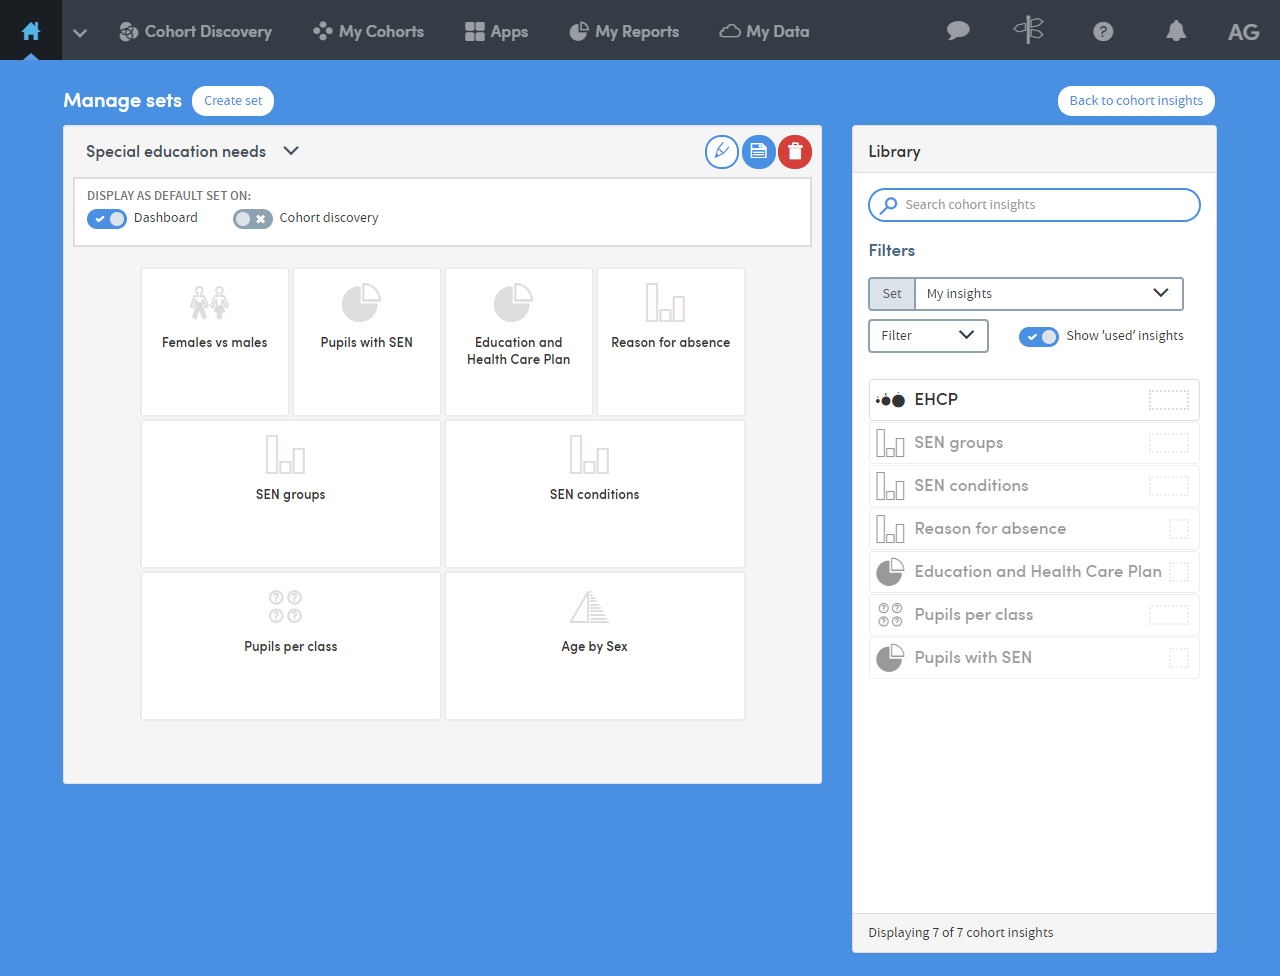
You’ll be taken to the Manage sets screen, which will look similar to this:
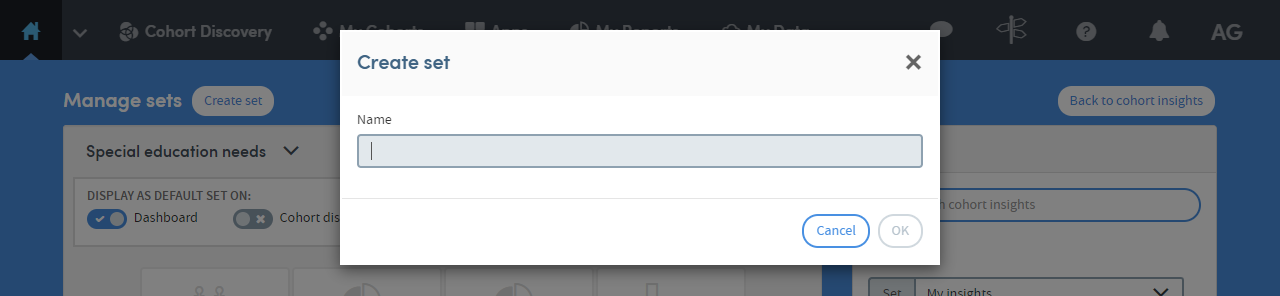
Click Create set, towards the top left of the screen:

You will be prompted to name the new set. Type in a name and click OK:
Your new, empty set will be displayed on screen:
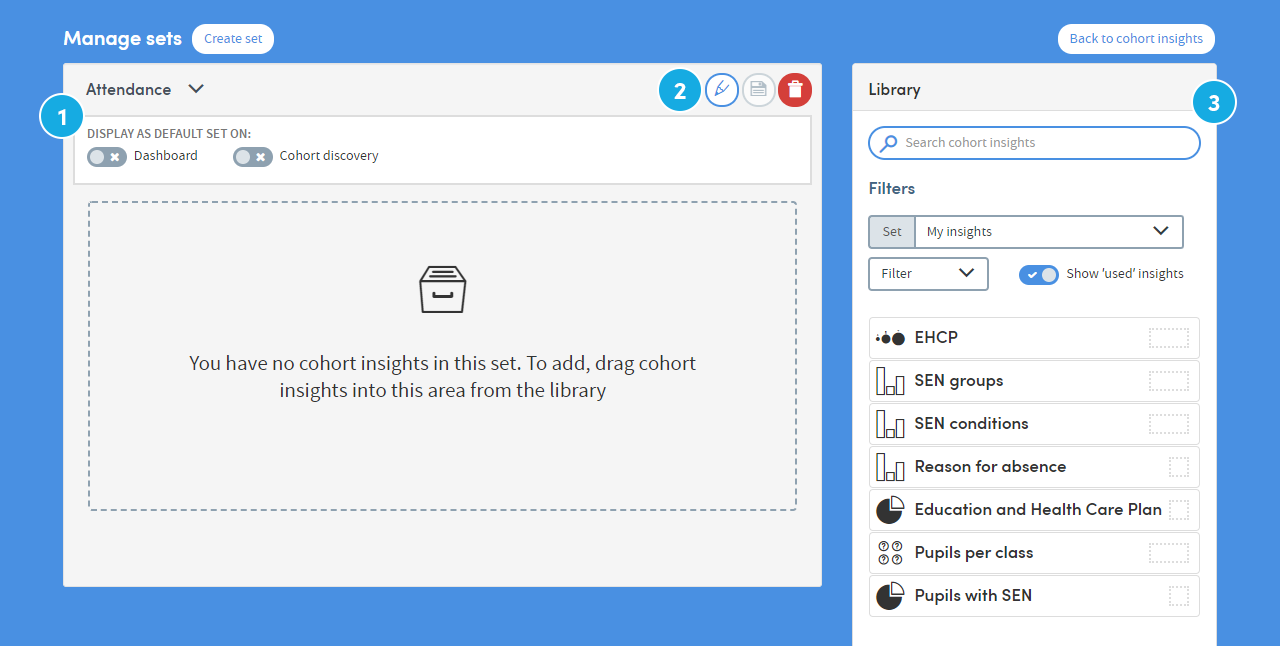
- Here you can see the name of your new set, and two options to use this set as the default display in your Cohort Insights dashboard and Cohort Discovery areas
- You can rename a set, save any changes you make, or delete a set here
- If you have a lot of insights to choose from, you can search by name, or use the Filters options to reduce the number of insights in your list and make navigation easier
To build your set, click and drag insights from the list on the right over to the empty pane on the left:
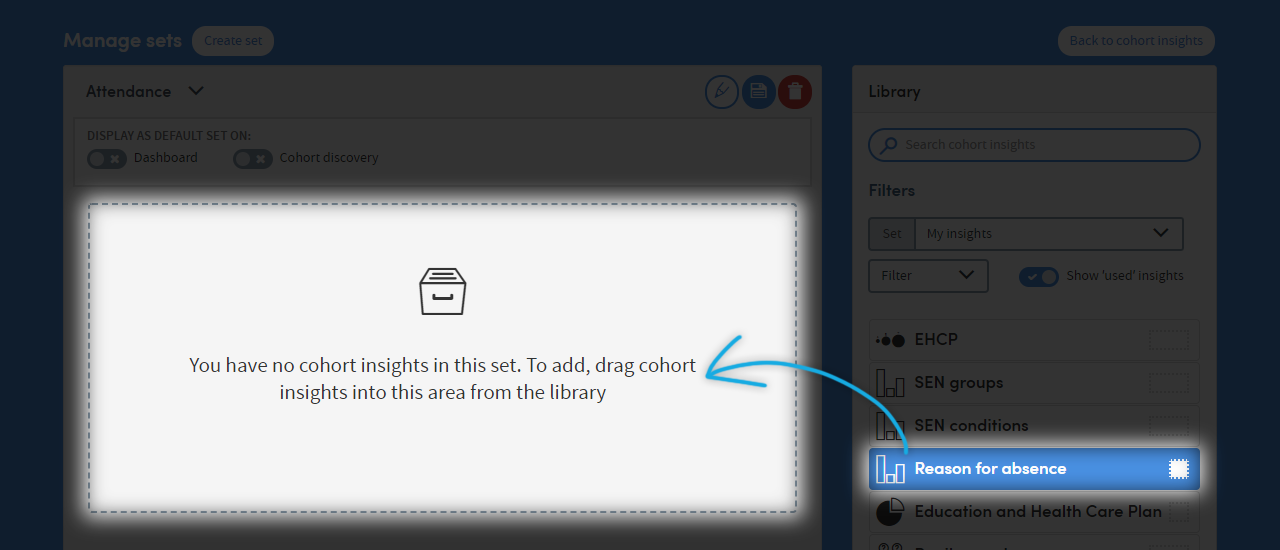
You can also click and drag the insights within the pane, to arrange them in whatever order you prefer.
Click the Save icon when you’ve finished.
To view your new insights set, click the back to cohort insights button on the top right of your screen:
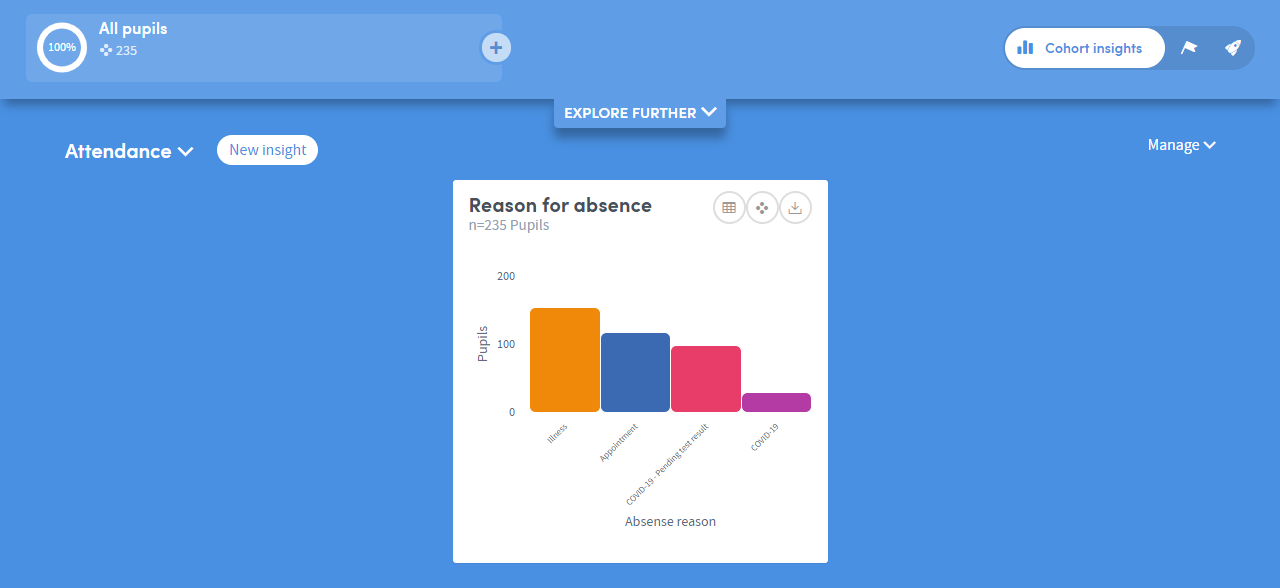
The Cohort Insights area will display your new set:
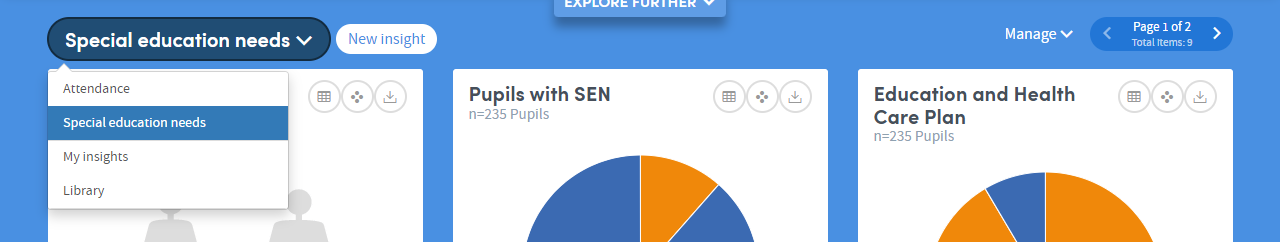
If you can’t see it, click the small arrow to the right of the insight set name on the top left, and choose your set from the list.
Further reading
- Previous article: Finding Your Way Around
- Next article: Activity Center
- Next article: Tracked Cohorts