Creating reports
Learn about our report wizards and the different kind of reports available in Atmolytics Cloud
Apps
Use the Apps area of Atmolytics Cloud to build reports about your data. Each app will produce its own specialised output, which you can configure.
-
To get started with creating reports navigate to the Apps area of Atmolytics Cloud from the primary navigation.
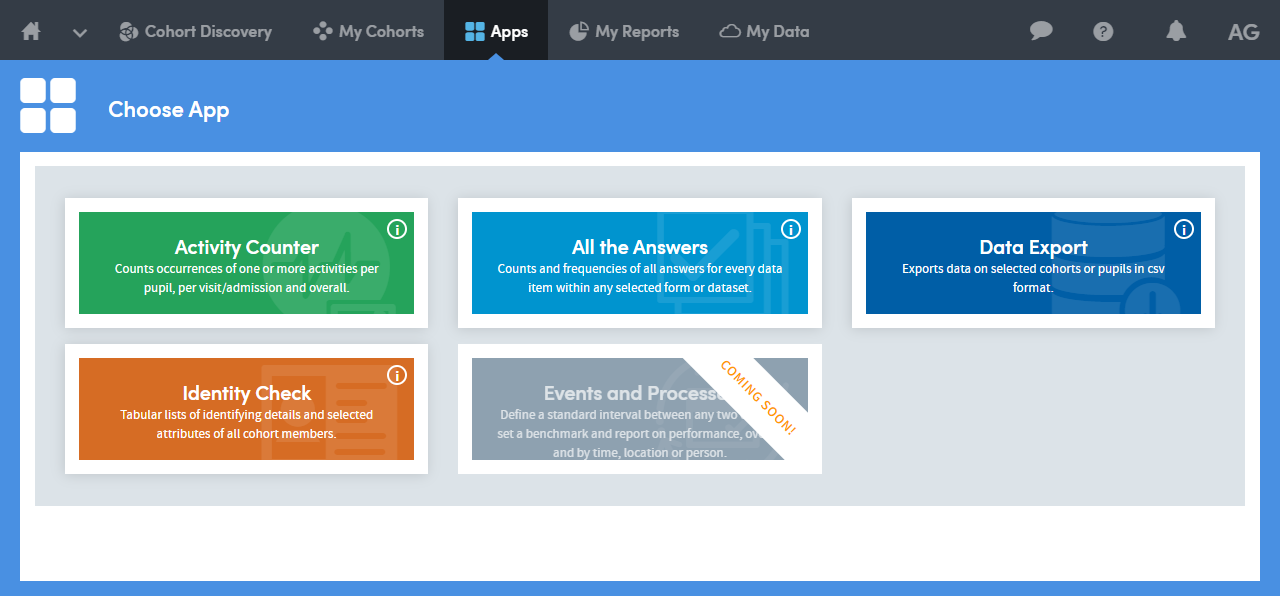 You can see what each app does and the types of output it produces by clicking on the icon within each app pane on the Apps screen.
 - Select an app to create a report, in the beta, there are four to choose from:
- Activity Counter: This App provides frequency counts of datasets. A great way to see how many extra datasets are present for each of your subject matter entities
- All the Answers: All the Answers reports are a great way to see all the variables from a selected dataset aggregated
- Data Export: The Data Export App exports data on selected cohorts in .csv format. Very handy for further analysis in Excel or dedicated statistical packages
- Identity Check: This App allows you to produce lists for many everyday purposes. Incorporate any of your variables from across your data. It has filter and sort functions
- Once you have chosen an app, you will enter the wizard for the app, there are three steps to the wizard:
- Who: choose the subjects you wish to report upon, you can select up to 2 groups to compare results
- What: choose the app-specific settings to tailor the output of your report
- Finish: give your report a name and description and set its layout options
The ‘Who’ step
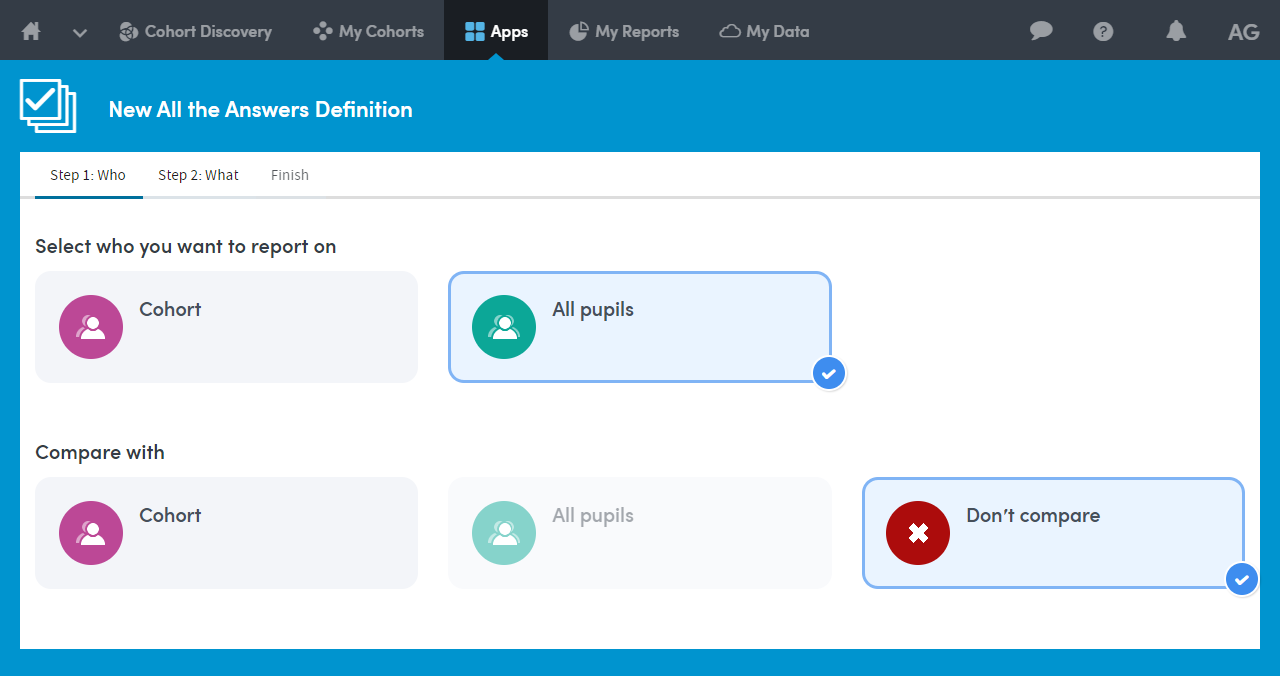 Depending on the App you’re using, you will be able to choose from Cohorts, or All data. Plus, you may be able to compare one selection with a second.
Make your selections and click Next to move on to the What: step.
The ‘What’ Step
The What step enables you to choose the settings you want to use in creating a report with the App you’ve selected. The What step is different for each App.
Activity counter
Activity counter provides you with a breakdown of which datasets your subjects have a record for.
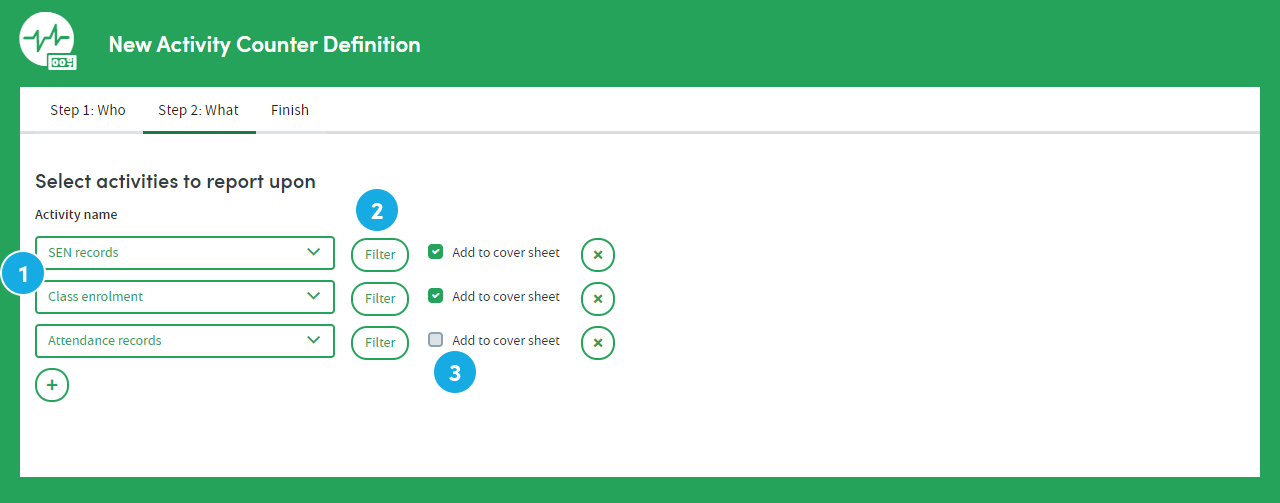
Here you’ll:
- Select dataset to report on;
- Filter your chosen datasets; and
- Add datasets to the report cover sheet
Learn more about report outputs
All the Answers
All the Answers provides an aggregate view for all the items within the dataset at cohort level.
Once you have selected the cohort you wish to report on, you’ll be asked the following:
Dataset
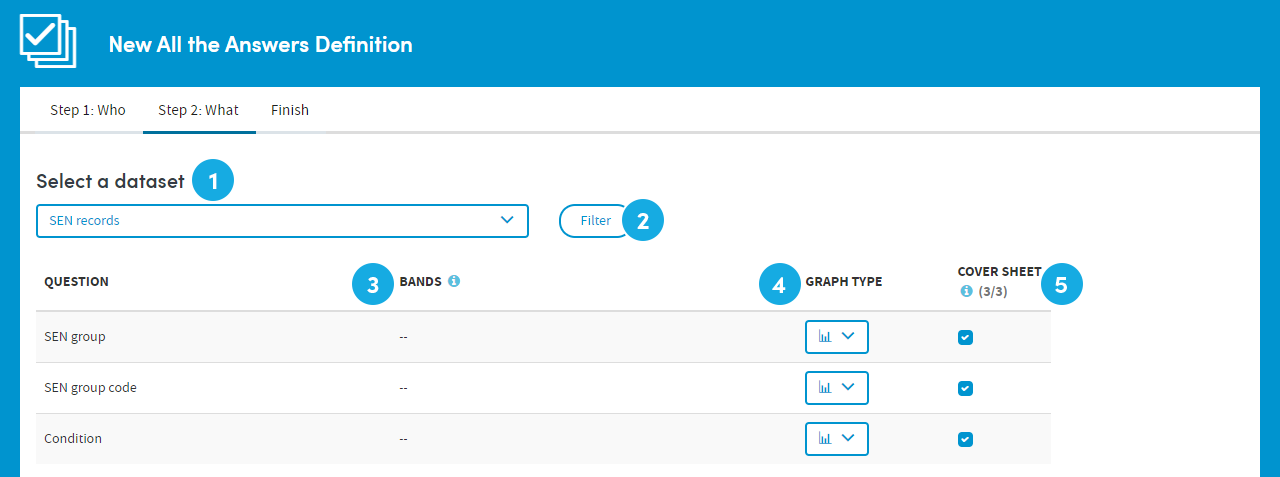
- Dataset: this is the dataset you will be generating aggregated totals for
- Filter: you can apply a filter to the cohort to only report on specific criteria
- Bands: for numeric data you can use default bands or specify custom bands to split your data into
- Graph type: choose how you want the graph to display
- Coversheet: you can pin upto four items to the coversheet of the report to get an overview of those datasets when you open the report Learn more about report outputs
Report by
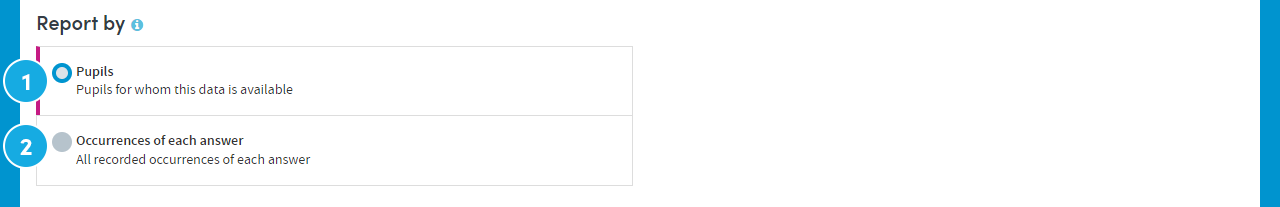
- Subject: aggregates the data based on those within your population who have an answer to the question
- Occurrences of each answer: aggregates the data based on instances of each occurrence of the data
Based on
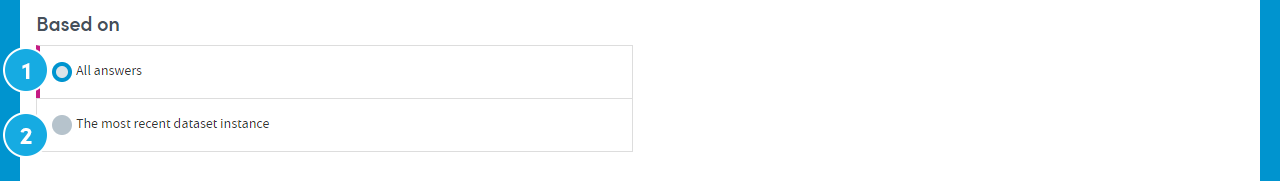
- All answers: looks across all instances of the dataset for members of the cohort
- The most recent dataset answer: takes the most recent answer given and excludes historical data
Use the icons to expand the guidance for individual settings.
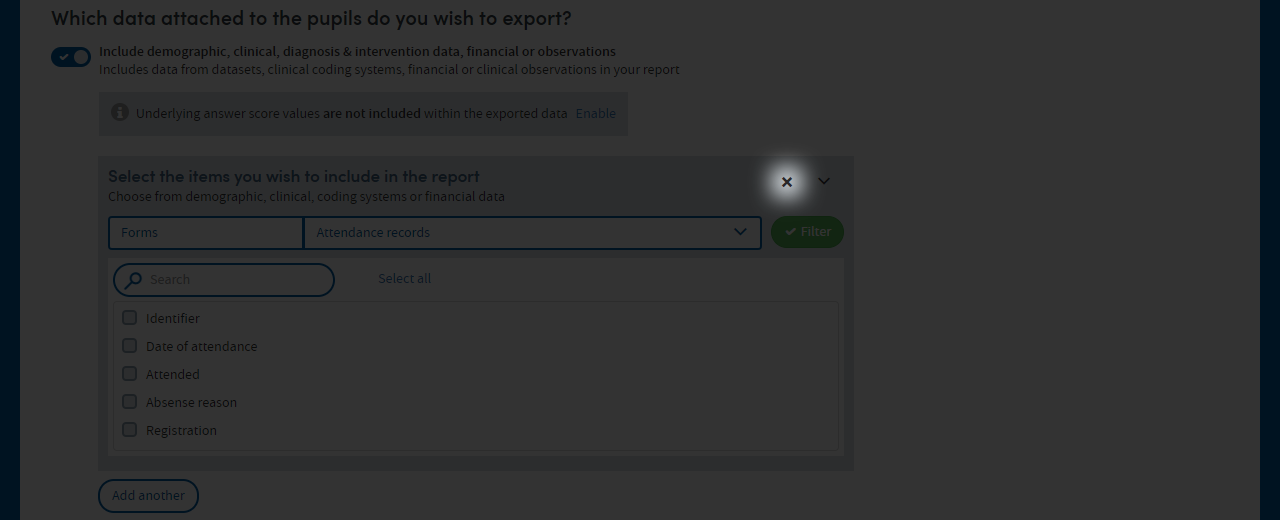
Data export
Data Exports allows you to extract and combine datasets.
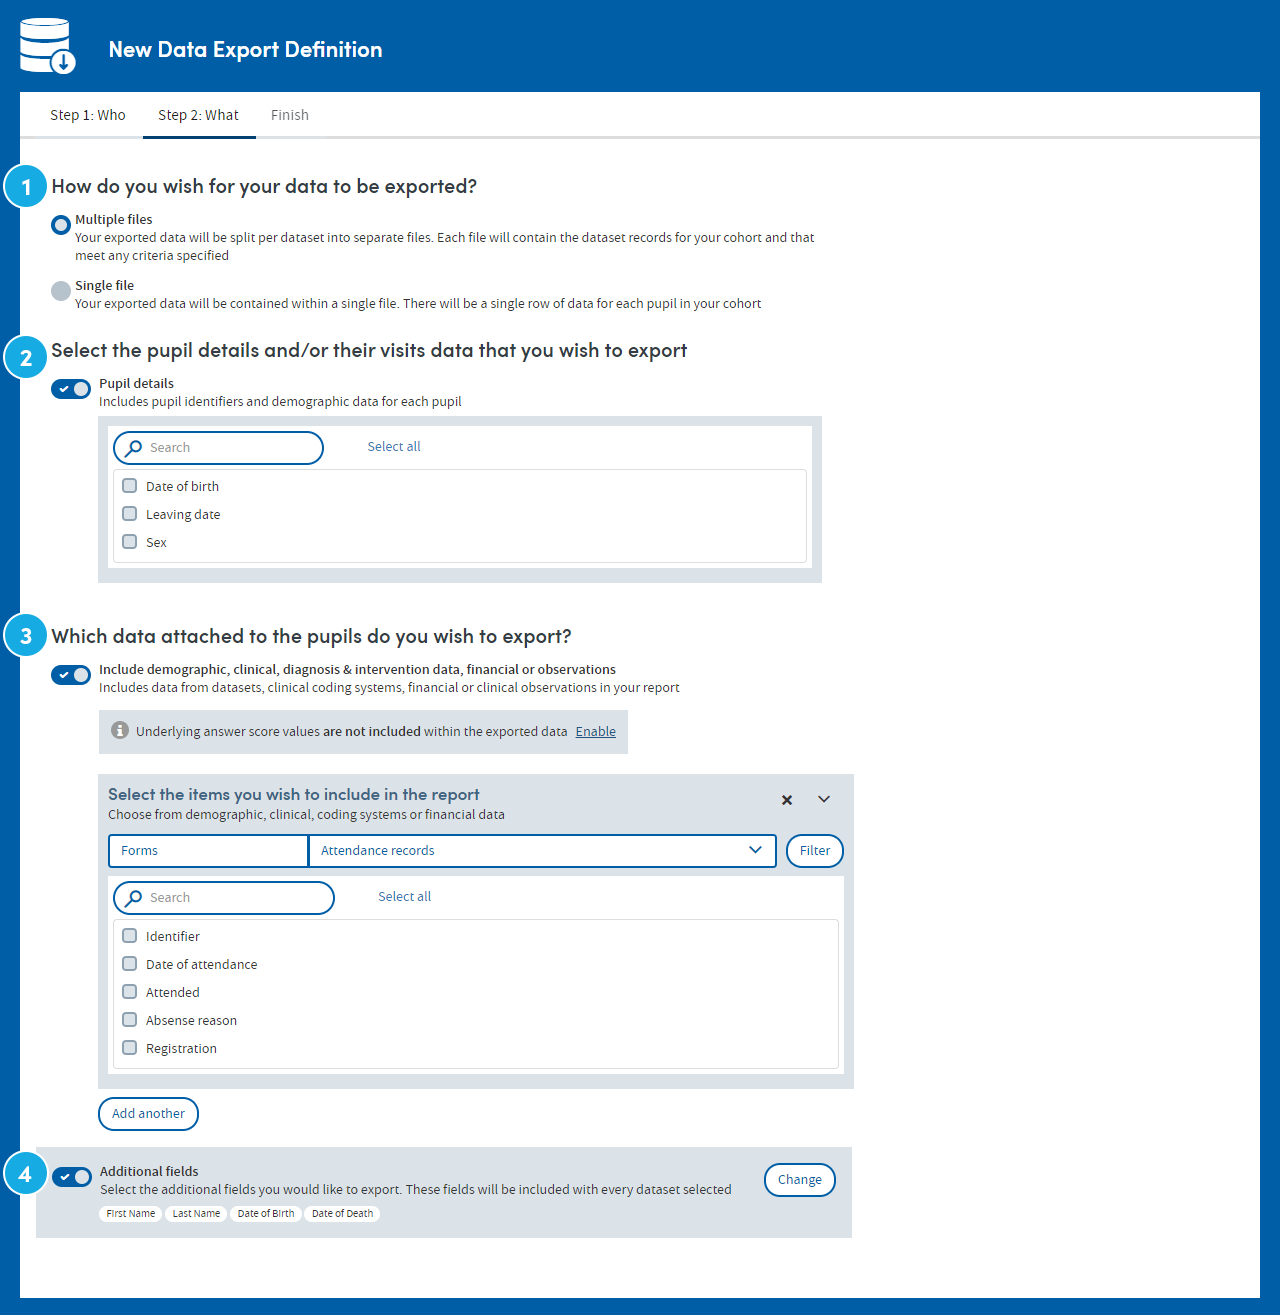
Here you’ll:
- Select what format you want the data to be exported;
- Select the data to export;
- Select the data attached to the datasets to export; and
- Choose any additional fields you want to export
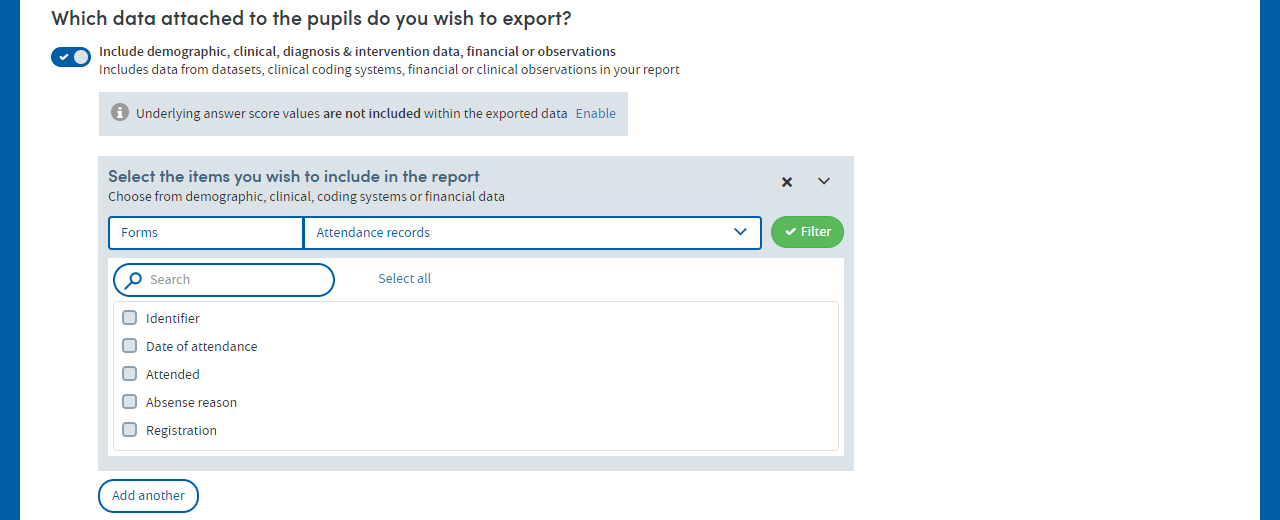
Filtering datasets
You can apply a filter to any selected dataset. This will allow you to refine the content of your export to include or exclude specified criteria within the recorded data. The filtering system works exactly as it does within the Cohort Discovery part of Atmolytics.
Removing a dataset
If you wish to remove a dataset from your export, click on the icon within box containing the relevant dataset:
Identity check
Identity check allows you to view data of a selected cohort and datapoints from your dataset into a single view.

Here you’ll:
- Select items to include in your report;
- Choose any additional items to include; and
- Choose the first column of the report output
The ‘Finish’ step
Once you have completed the What step, click Next and the wizard will move onto the final stage.
Here you will need to name your report and add descriptions if required. You can also add this report to your Favourites, so that you can locate it again quickly.
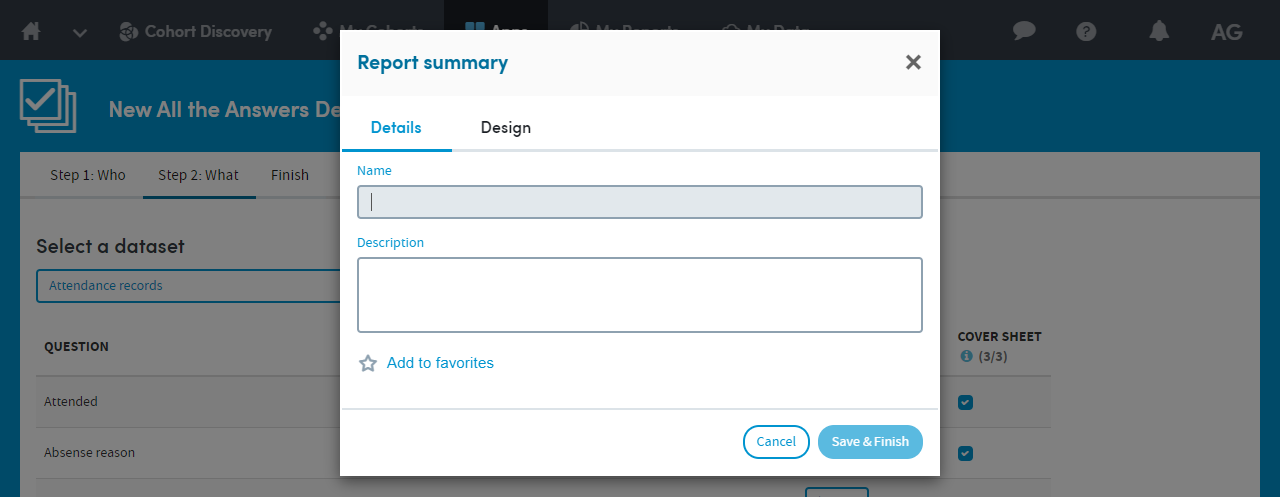
Use the tab to configure design, colour and layout options for the finished report.
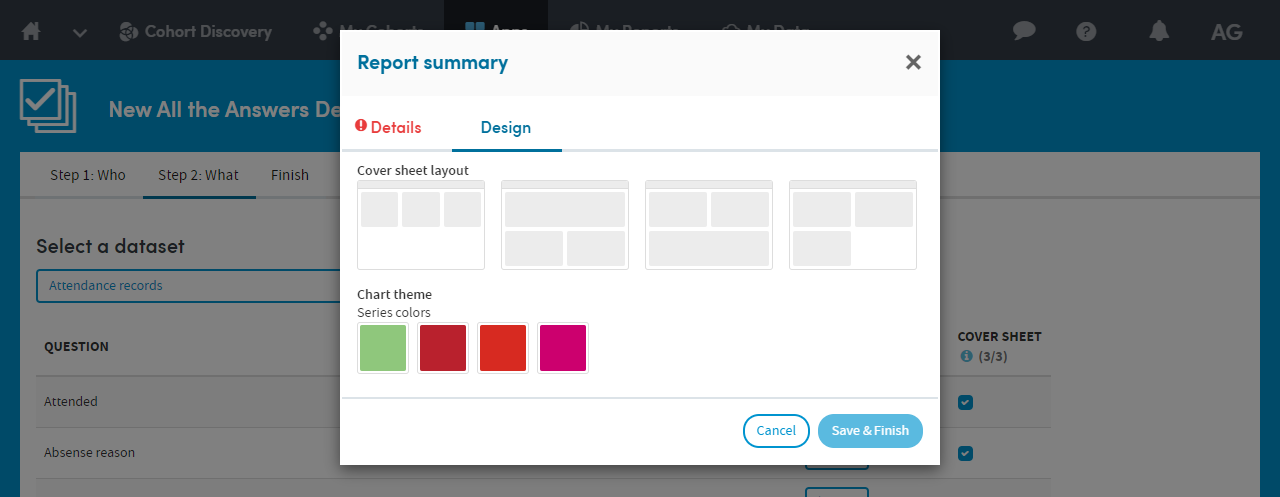
Click Save & Finish to create the report. The system will immediately construct and run the report based on your settings. You can view the progress and final report in the My Reports area of Atmolytics Cloud.

Further reading
- Previous article: Cohort Discovery
- Next article: Understanding Report Outputs